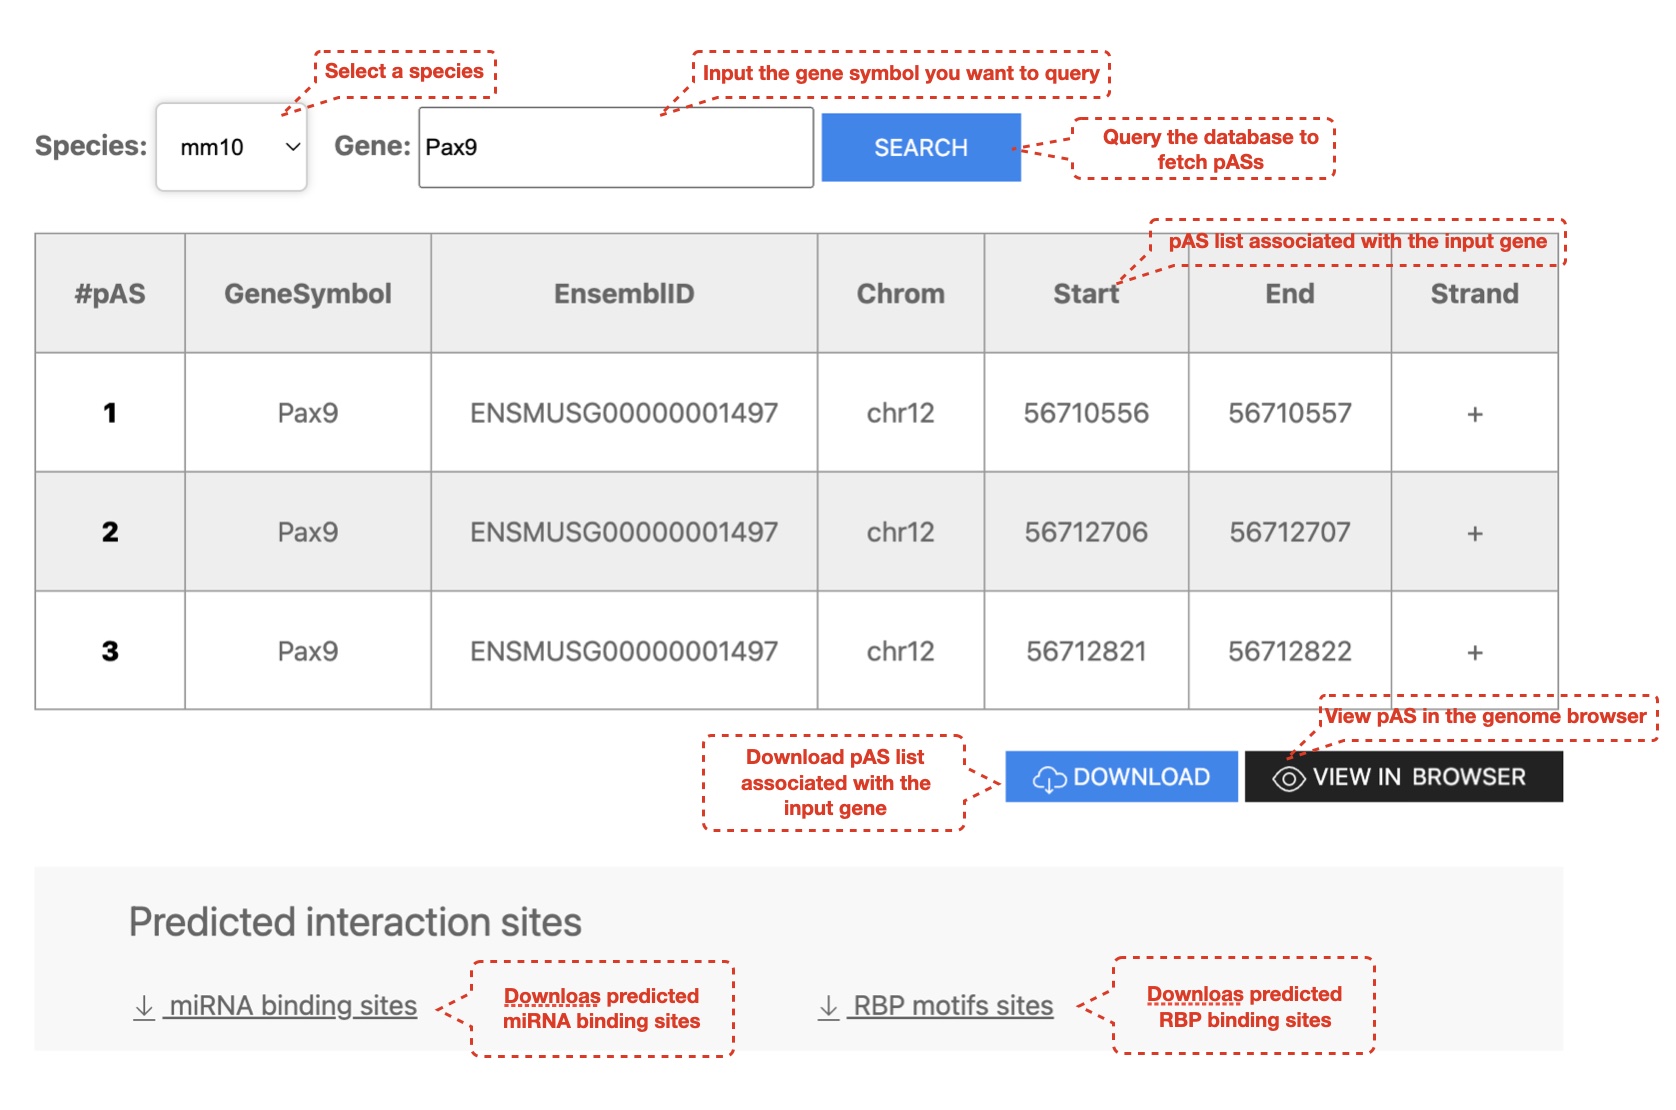
1. User can search for pASs in human and mouse genome
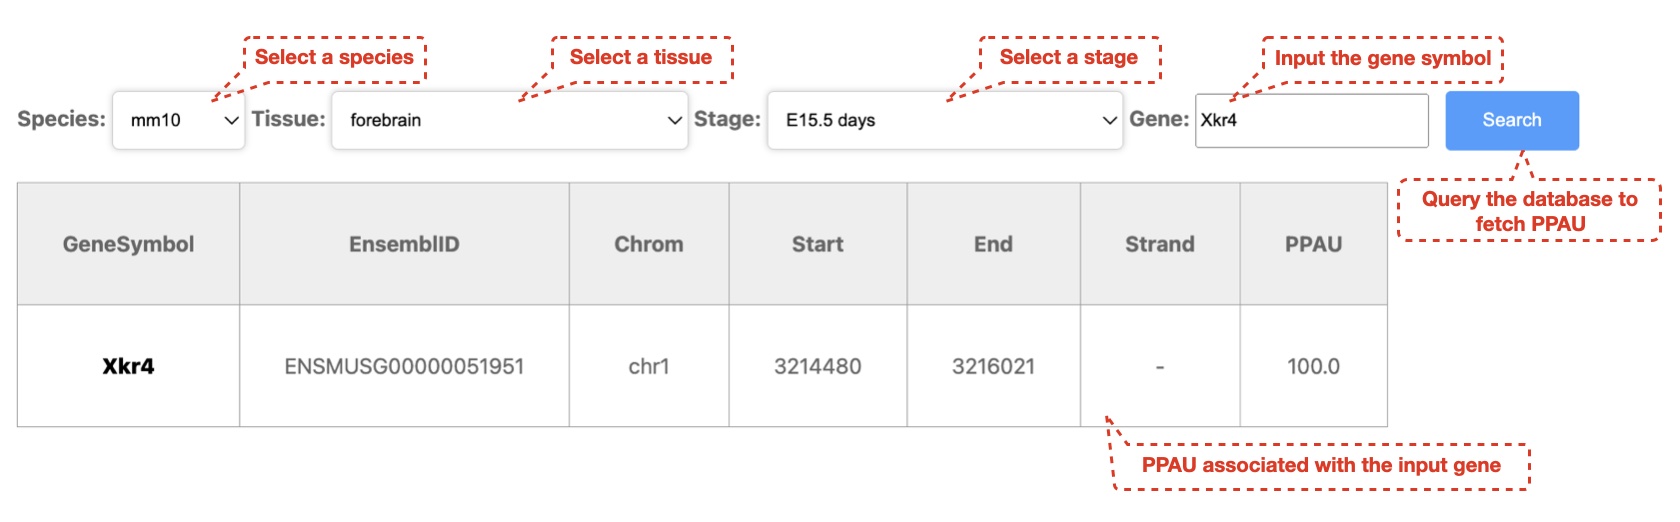
2. User can search for polyA usage across human and mouse development samples
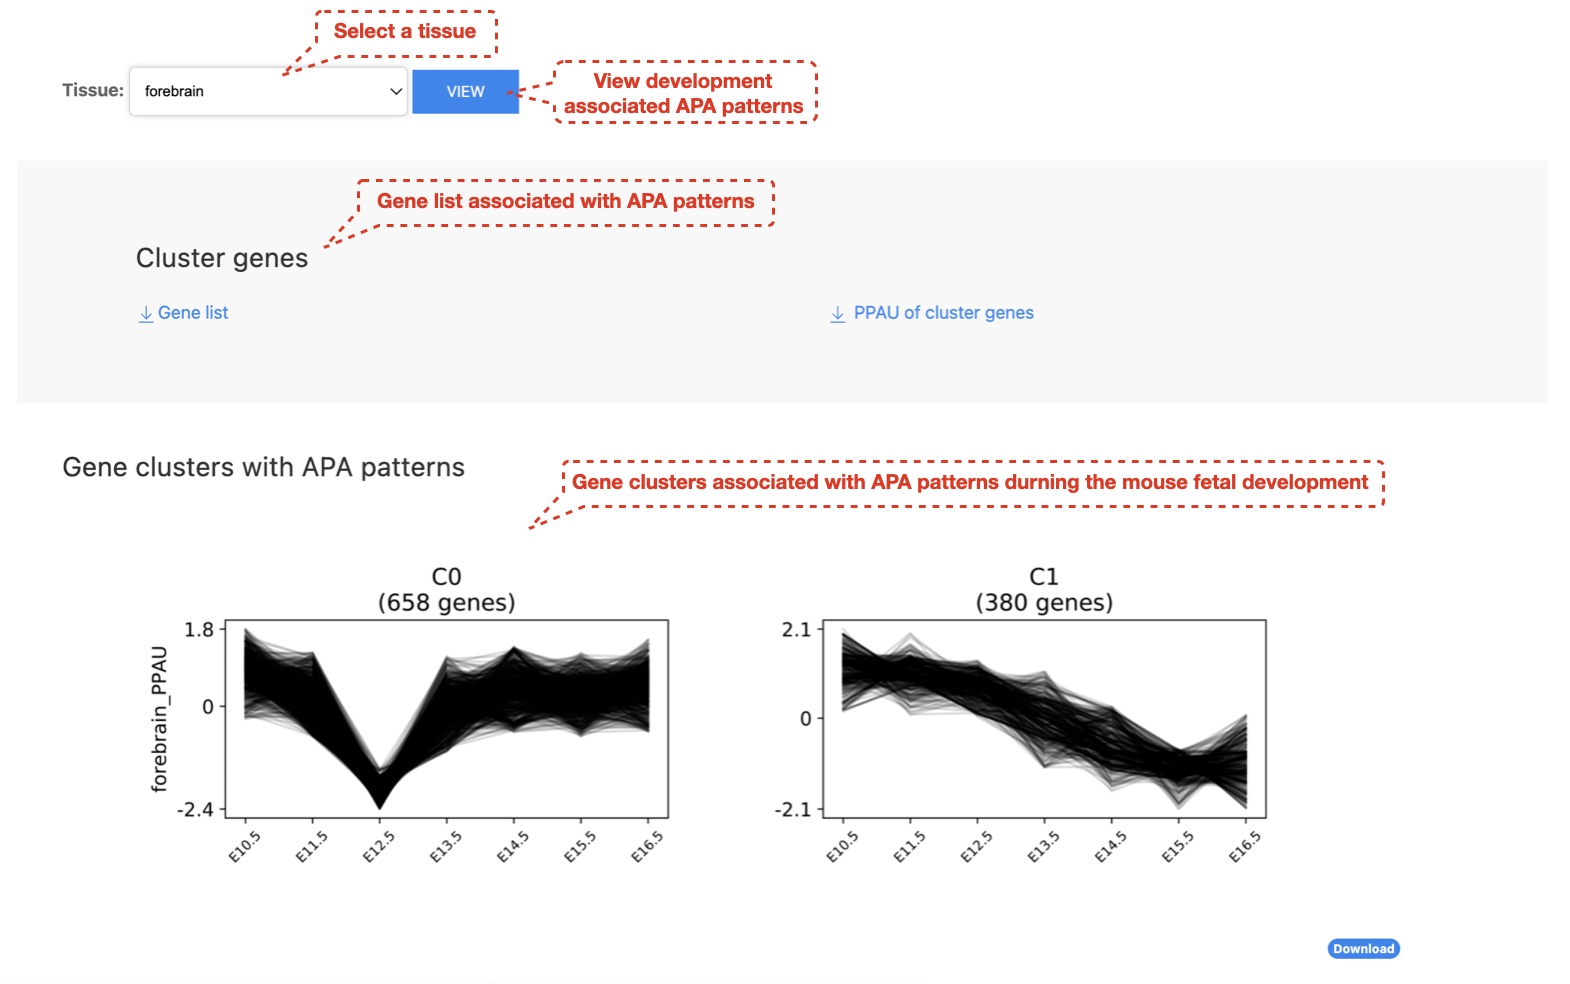
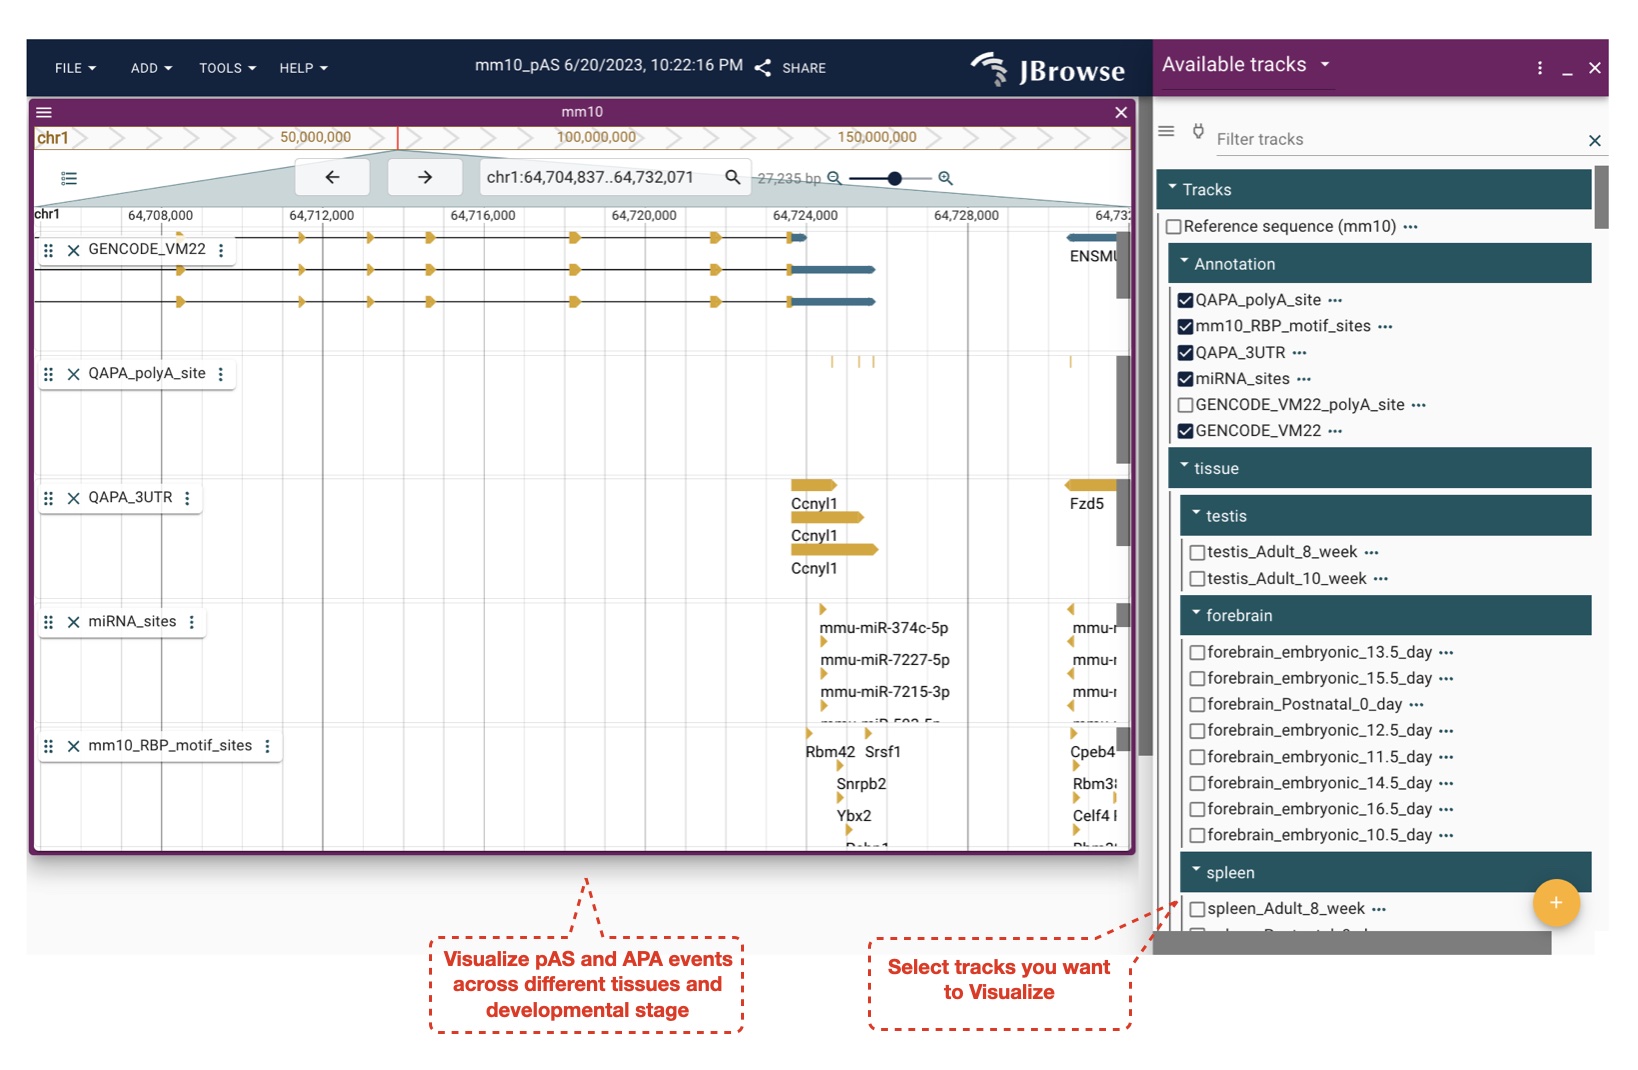
3. User can visualize APA patterns during mouse fetal development across different tissue types

We used the QAPA (version: 1.3.0) pipeline to identify expressed pASs in mouse and human biosamples with ribo- or polyA+ RNA-seq datasets. First, pAS annotations were built based on the PolyASite database (N = 301,001) and pASs downloaded from GENCODE Basic gene annotations (mouse: mm10 vM22, N = 31,367; human: hg38 v31, N = 49, 884), and the corresponding 3' UTR sequences were then extracted to profile the APA landscape. Second, the expression of each 3' UTR sequence was quantified with the Salmon algorithm (version 0.14.0) for each biosample, and the relative usage of each pAS in a gene was summarized using QAPA. Reads from biological replicates were pooled together before quantifying the expression of 3' UTRs. If one pAS could be detected with an expressed 3' UTR sequence in at least one biosample, this pAS was deemed expressed in our study. To systematically evaluate APA events, the metric "PolyA Usage" (PAU), defined as the ratio of the expression of the corresponding 3' UTR to the total 3' UTR expression of the same gene, was calculated for each pAS, and the PAU of the most proximal pAS deemed PPAU (Proximal PAU). To exclude potential false positives, PAUs were only calculated for genes with sufficiently high expression levels (TPM ≥ 0.1).
We first classified 3' UTRs into the aUTRs (alternative UTRs) and cUTRs (constitutive UTRs). High-confidence binding sites of microRNAs (score >= 50) were extracted from the miRDB database. Counts of microRNA binding sites located in the 3' UTR region of genes were calculated using bedtools. AME algorithm from the MEME toolkit was used to scan RBP motifs from the MEME CIS-BP database by comparing motif matches between the aUTR and cUTR regions of genes in the PPAU-down groups, and enriched RBP motifs were identified with Bonferroni corrected p-value ≤ 1.00 × 10³.
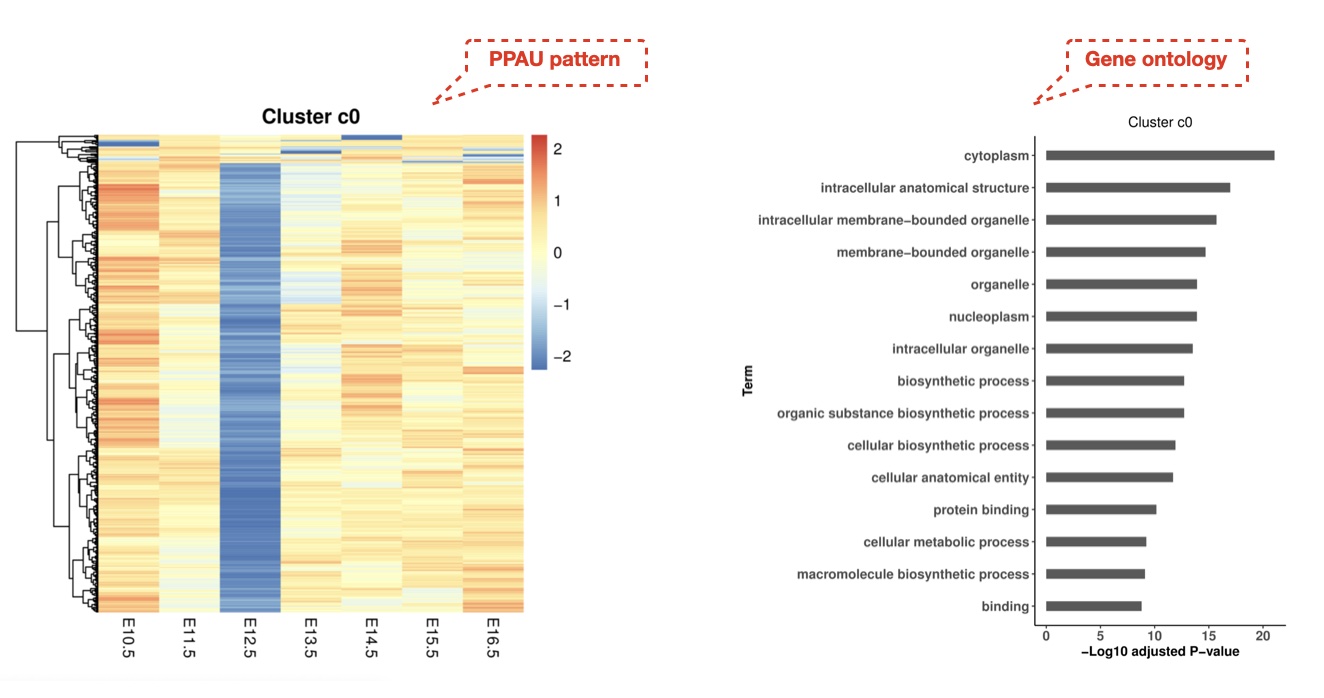
We clustered PPAU profiles throughout the mouse fetal development in forebrain samples using the time series pattern extraction method clust (parameter: -n 0 3 4) which is based on k-means clustering, and significant APA patterns were selected for downstream analyses. Gene ontology enrichment analysis was performed with the gprofiler2 R package (version: 0.1.9), and enriched gene ontology terms (FDR < 0.01) were extracted.
Xiao-Ou Zhang, Ph.D, Professor
zhangxiaoou@tongji.edu.cn
Xin Chen, Master student
xinchen9705@163.com
Qin Wang, Ph.D
qwang601@gmail.com